
Let’s talk about linux system calls. Simply put, system calls are the primary way that programs interface with the operating system. I would go as far as to say that a basic understanding of system calls is a requirement for any serious Linux user.
The system call interface includes a number of functions that the operating system exports to the applications running on top of it. These functions allow actions like opening files, creating network connections, reading and writing from files, and so on. In practice, most of the things that happen on any machine involve going through a system call. As a consequence, observing system calls can offer great insight into what a program is doing, and can be invaluable for troubleshooting, monitoring, and bottleneck identification.
So, are you curious about how the system call interface works in Linux? Do you want to learn how to trace system calls and what useful things you can do by tracing them? Are you curious which system calls are worth watching and why?
Then keep reading, this post is for you.
Let’s start with a bit of theory.
How system calls work in Linux
Wikipedia defines a system call in the following way:
*In computing, a system call is how a program requests a service from an operating system’s kernel. This may include hardware related services (e.g. accessing the hard disk), creating and executing new processes, and communicating with integral kernel services (like scheduling). System calls provide an essential interface between a process and the operating system. *
System calls look like function calls to programs using them, but in practice they are a bit more complicated than a function call, because they require a transaction from user mode to kernel mode.
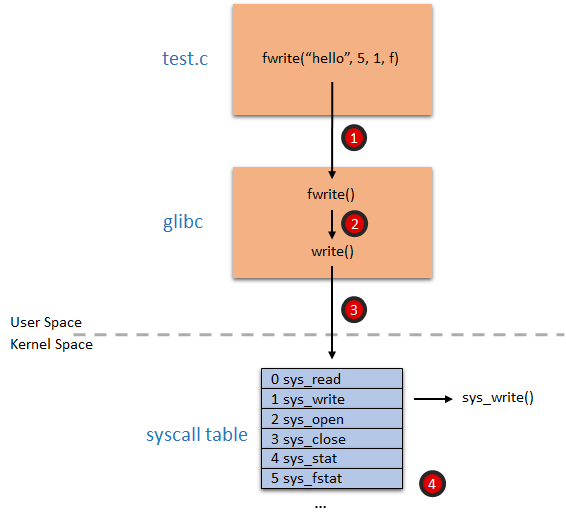
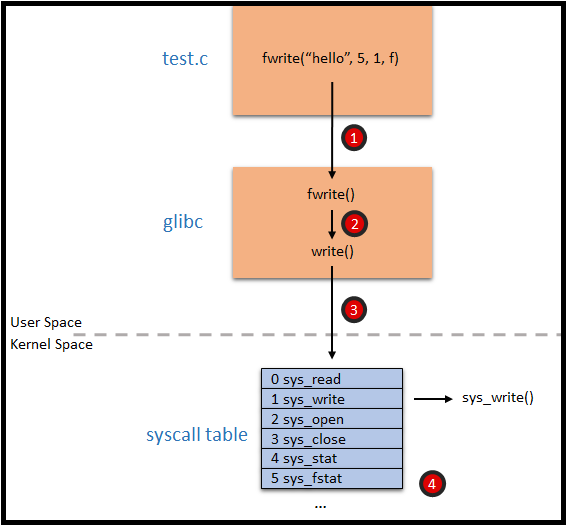
The following picture shows the sequence of steps involved in calling one of the basic functions of the C standard library, fwrite (note, this is simplified a bit for clarity):
Here are the steps that the process involves:
- fwrite, together with the rest of the C standard library, is implemented in glibc*, which is one of the core components of the Linux operating system.
- fwrite is essentially a wrapper for the write library call.
- write will load the system call ID (which is 1 for write) and arguments into the processor registers, and then cause the processor to switch to kernel level. The way this is done depends on the processor architecture, and sometimes on the processor model. For example, x86 processors usually call interrupt 80, while x64 processors use the syscall processor instruction.
- the processor, now executing in kernel space, feeds the system call ID to the syscall table, extracts the function pointer at offset 1 and calls it. This function, sys_write, is the kernel implementation of writing a file.Don’t believe me? You can try this code
# ----------------------------------------------------------------------------------------
# helloworld.s. Hello world in assembly!
# ----------------------------------------------------------------------------------------

     .global _start

    .text
_start:
# write(1, message, 13)
    mov     $1, %rax                # system call ID. 1 is write
    mov     $1, %rdi                # file handle 1 is stdout
    mov     $message, %rsi          # address of string to output
    mov     $13, %rdx               # string length
    syscall                         # system call invocation!

# exit(0)
    mov     $60, %rax               # system call ID. 60 is exit
    xor     %rdi, %rdi              # we want return code 0
    syscall                         # system call invocation!
message:
    .ascii  "Hello, worldn"
Compile it with
$ gcc -o helloworld -nostdlib helloworld.s
Yep, this is the lowest possible level hello word implementation on an x64 processor. It prints hello world on standard output with no dependency whatsoever, just the Linux kernel. :-)
If being that low level makes you nervous, glibc offers you a function called syscall that you can use to explore the system call interface.
#include <sys/syscall.h>

int main() {
    syscall(SYS_write, 1, "Hello, worldn", 13);
    return 0;
}
How to monitor system calls
There’s a handful of tools that can be used to watch system calls. The most well-known one, strace, is available on many operating systems and you probably already have it on your machine. In its simplest form, you invoke it followed by the name of the process you want to monitor
> strace myprogram
sysdig is the new kid on the block, and you install it by following these instructions. There’s a lot you can do with sysdig, but in its simplest form you just run it and you will see all the system calls that are happening on the system. Since that tends to be quite a lot, you can use sysdig with filters to make its output more digestible:
> sysdig proc.name=myprogram
Since this happens to be the sysdig blog, the rest of this post will focus on sysdig as the system call capture tool. If you need help interpreting sysdig’s output, you can refer to yesterday’s blog post: Interpreting Sysdig Output.
The system calls you should watch
**clone (man page)
****what it does
** Creates a new process
**why you should watch it
**Clone is essentially ** the only Linux kernel entry point to create processes and threads. This means that looking at it allows you to observe all process and thread execution activity. The return value is 0 in the child thread and the child pid in the parent thread. Clone is one of the most complex system calls, and has a lot of flags that can tell you a lot about the new process that is being created.
** sysdig filter
**evt.type=clone
** Notes
** Clone is the only system call that returns twice (!), once in the parent process and once in the child process. Don’t let that confuse you. :-) Clone tends to be expensive, so check that your app doesn’t call it too much.
execve **(man page)
****what it does
**Executes a new program
**why you should watch it
**Execve is the only Linux kernel entry point to run a program. The user space API has several variants like execl and fexecve, but they all end up invoking the execve system call. You will almost always see execve after a clone, and monitoring execve invocations will tell you what’s been executed in your system. Every single program, script or cron job will have to go through execve.
**sysdig filter
**evt.type=execve
**chdir (man page)
****what it does
**Changes the current process working directory
**why you should watch it
**If execve shows you every command line that is executed, chdir shows you every directory that is visited, by anyone. Try to run
> sysdig evt.type=chdir
and then visit a directory from a different shell. :-)
**sysdig filter
**evt.type=chdir
**open/creat (man page)
****what it does
**Opens and possibly creates a file or device
**why you should watch it
**By tracing this system call, you will see when files are created or touched.
**sysdig filter
**evt.type=open
evt.type=creat
**Notes
**Using filters makes tracing this system call in sysdig much more productive (and fun). For example:
> sysdig evt.type=open and proc.name=evilproc and file.name contains /etc
> sysdig evt.type=open and proc.name=niginx and file.name contains .log
**connect (man page)
****what it does
**Initiates a connection on a socket
**why you should watch it
**This is the only kernel entry point to establish a network connection. Every time a process on your machine tries to connect to something, you will see this system call.
**sysdig filter
**evt.type=connect
**Notes
**Again, use filters to increase the fun factor. For example:
> sysdig evt.type=connect and fd.port=80
> sysdig “evt.type=connect and fd.sip!=127.0.0.1”
**accept (man page)
****what it does
**Accepts a connection on a socket
**why you should watch it
**This system call mirrors connect, in the sense that you will see one every time a server connection is established on the machine.
**sysdig filter
**evt.type=accept
**Notes
**Filters for fun factor. For example:
> sysdig evt.type=accept and fd.port=80
> sysdig “evt.type=accept and proc.name=nginx and fd.port!=80”
**read (man page) / write (man page)
****what they do
**read and write system calls have many variants in the Linux system call interface: readv, writev, preadv, pwritev, send, recv, sendto, recvfrom, sendmsg, sendmmsg, recvmsg, recvmmsg. They all pretty much do the same thing, read or write data to a file descriptor, which is the heart of doing I/O.
**why you should watch them
**Observing these calls is pretty handy, since almost everything in Linux happens to be a file descriptor. They will show accesses to files, network data exchange, activity on pipes and unix sockets. See yesterday’s post for more info on file descriptors.
**sysdig filter
**evt.is_io=true
**Notes
**sysdig offers a chisel to esaily observe the I/O activity. You want to use it with a filter, like this
> sysdig -c echo_fds fd.name=/etc/passwd
or like this
> sysdig -c echo_fds proc.name=nginx and fd.port!=80
Make sure to familiarize yourself with this chisel, because it’s incredibly useful in many situations.
**unlink (man page) / rename (man page)
****what they do
**delete or rename files
**why you should watch it
**While open/creat tell you when new files are created, and the read/write variants tell you when files are modified, unlink and rename tell you when files are deleted or renamed.
**sysdig filter
**evt.type=unlink
evt.type=rename
**brk (man page) / mmap (man page) / munmap (man page)
****what they do
**allocate/free memory
**why you should watch them
**If you want to observe when a process allocates or frees memory, these are the system calls to watch. brk is traditionally used by malloc(), while mmap/mmunmap are more versatile and they are used for several things including sharing memory or mapping files to memory.
**sysdig filter
**evt.type=brk
evt.type=mmap
evt.type=munmap
**Notes
**Careful: memory management is a complex subject, way beyond the scope of this blog post. You will almost never see a brk or mmap as a consequence of a malloc() or new() in your program, because your typical program will likely go through at least one or two entities before getting its memory. For example, glibc has a memory allocator that requests memory from the kernel in big chunks and then manages it at user level. The garbage collector of your favorite VM-based language does something similar.
**select (man page) / poll (man page)
****what they do
**wait for something
**why you should watch them
**Every time a process is not actively doing something, it’s very likely going to be stuck in one of these two calls. Observing their arguments will tell you what it’s waiting for and for how long.
**sysdig filter
**evt.type=select
evt.type=poll
**kill (man page)
****what it does
**sends signal
**why you should watch it
**kill is used by a process to send a signal to another process.
**sysdig filter
**evt.type=kill
Conclusion
Getting familiar with system calls is not only an incredibly useful tool in your toolbelt, it’s also extremely fun, so I encourage you to experiment yourself. If you do, by the way, this nice printable cheat sheet offers a good high-level reference.
Also, we’re posting useful sysdig command lines on a regular basis from the sysdig twitter account, so make sure to follow us!
*If you are curious and want to explore, the internal name is _IO_file_fwrite.
**There are also two additional system calls called fork and vfork, but they are used extremely rarely.