
With containers becoming more and more ubiquitous across modern IT environments, a growing number of organizations are seeing a real need for monitoring solutions to adapt to today’s “containerized” reality.
I’ve had countless discussions over the past few months with everyone from startup engineers to Fortune 500 CIOs: it is clear that not only is better visibility into container infrastructures sorely needed, but this lack of visibility is one of the main barriers to the adoption of containers. The container monitoring space is still relatively immature, and we believe the container community is still missing a really excellent visibility solution. It seems to us here at Sysdig Cloud that the few approaches that have been attempted are an evolution of the current monitoring techniques, while containers are clearly a revolution.
Today I’m proud to announce Sysdig Cloud’s revolutionary new approach to container monitoring. For the first time, you can now get deep visibility into containers from the outside, without instrumenting the container itself.
Sysdig Cloud’s new container support is built on the same open source sysdig container tech that our founder/CEO, Loris Degioanni, revealed in gory technical detail in his post this morning. Sysdig Cloud now extends sysdig’s deep container visibility beyond the local machine, providing unified insight across your entire distributed, containerized infrastructure.
Let’s first take a look at why this approach is so revolutionary, and then I’m excited to show you some of the amazing things you can now accomplish with Sysdig Cloud.
Why Container Monitoring Sucks
If you want to monitor a container-based infrastructure today, you’re essentially stuck with three options:
- Limit yourself to the handful of high-level metrics that container runtimes export (e.g. per-container memory or CPU usage)
- Limit yourself to metrics exported directly from your application from within each container (eg. by using statsd)
- Instrument each of your containers individually with monitoring tools and agents
I assume it’s pretty clear why the first option is not satisfactory, at least with the current state of container self-reporting.
The second option – statsd and friends – is great for application data, but you’ll still be completely blind on your infrastructure. You may be able to see application-level metrics, but you have no system context. Essentially this is not a container monitoring solution at all. This also doesn’t cover other key application components you might have inside containers like web servers, middleware and databases – which can all of course contribute to performance issues.
And as for the third option, installing agents and monitoring tools in each container is painful and limiting and generally not advisable for a number of reasons:
- Most importantly: this goes against the fundamental philosophy of containers. From Docker’s best practices document: “In almost all cases, you should only run a single process in a single container”. If you are going to pollute your containers with added processes, you are undercutting many of the core benefits you sought from containers in the first place: performance, deployability, portability, dependency simplification, etc.
- Installing software in each container is also tricky from the implementation point of view, because Docker by default just executes a single process in the container. If you want to run multiple processes, then a proper process manager (e.g. systemd or supervisor) must be installed and configured, which causes further pain during troubleshooting.
- Having to add an agent to each container also makes it much harder to leverage the tens of thousands of images available on Docker Hub, thus defeating one of the best Docker features.
- And finally, any additional processes – especially an agent – are an added security risk inside the container.
It comes down to this: current solutions are trying to repurpose or hack around legacy monitoring techniques and technologies, that were not designed for the complexity and nuances of containerization. Evolutionary approaches are just not going to cut it.
A Revolution: Sysdig Cloud’s Container Monitoring Solution
What if there was a better way to monitor containers? Starting today, there is.
Sysdig Cloud’s new approach to monitoring leverages our open source sysdig technology to provide best in class visibility into Docker, LXC, and libvirt-lxc container technologies. At a high level, it is as simple as this: with Sysdig Cloud you get full visibility inside every container, but you do it from outside the containers.
Sysdig Cloud’s approach is grounded in the fact that containers all share a common kernel with their host OS. The Sysdig Cloud agent is installed on the host OS or into its own privileged container. From here, Sysdig Cloud is able to collect the internal activity of every container, along with the broader context of the host system! And of course all the information is then correlated together across all of your distributed host systems – containerized or not.
The result? A holistic view of your entire distributed infrastructure and full context into how containers interact with each other and with other components of your systems. PLUS the ability to drill down into what happens inside any container, no matter what popular container technology you’re running.
With this newfound deep visibility into containers, you can, for the first time, do things like:
- Analyze process execution, file system activity, and network activity inside your containers in a single view
- Visualize the dependencies in your containerized environments to quickly isolate the root cause of performance issues
- Inspect application activity inside your containers like HTTP error codes, URL response times, and database queries
Again, all of this is achieved without needing to instrument the container OR your application code.
Sysdig Cloud Container Monitoring Features
Now for the fun part – a quick look at some of our coolest new features!
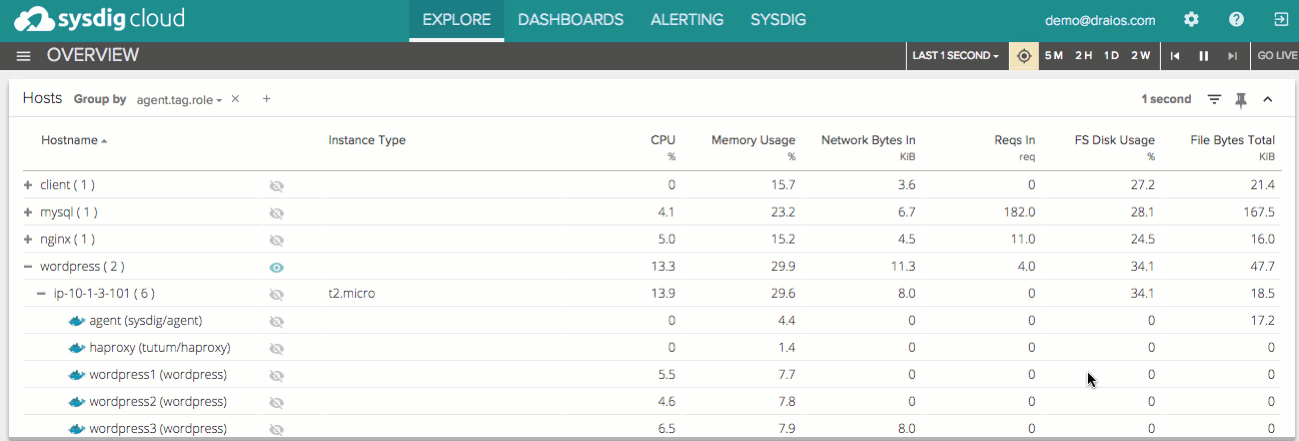
Right off the bat, Sysdig Cloud enables your team to view the state of your entire containerized environment in a single pane with one-second granularity. You can view and group this information a number of different ways to analyze high-level system metrics like CPU % and Memory Usage across your hosts and container images.
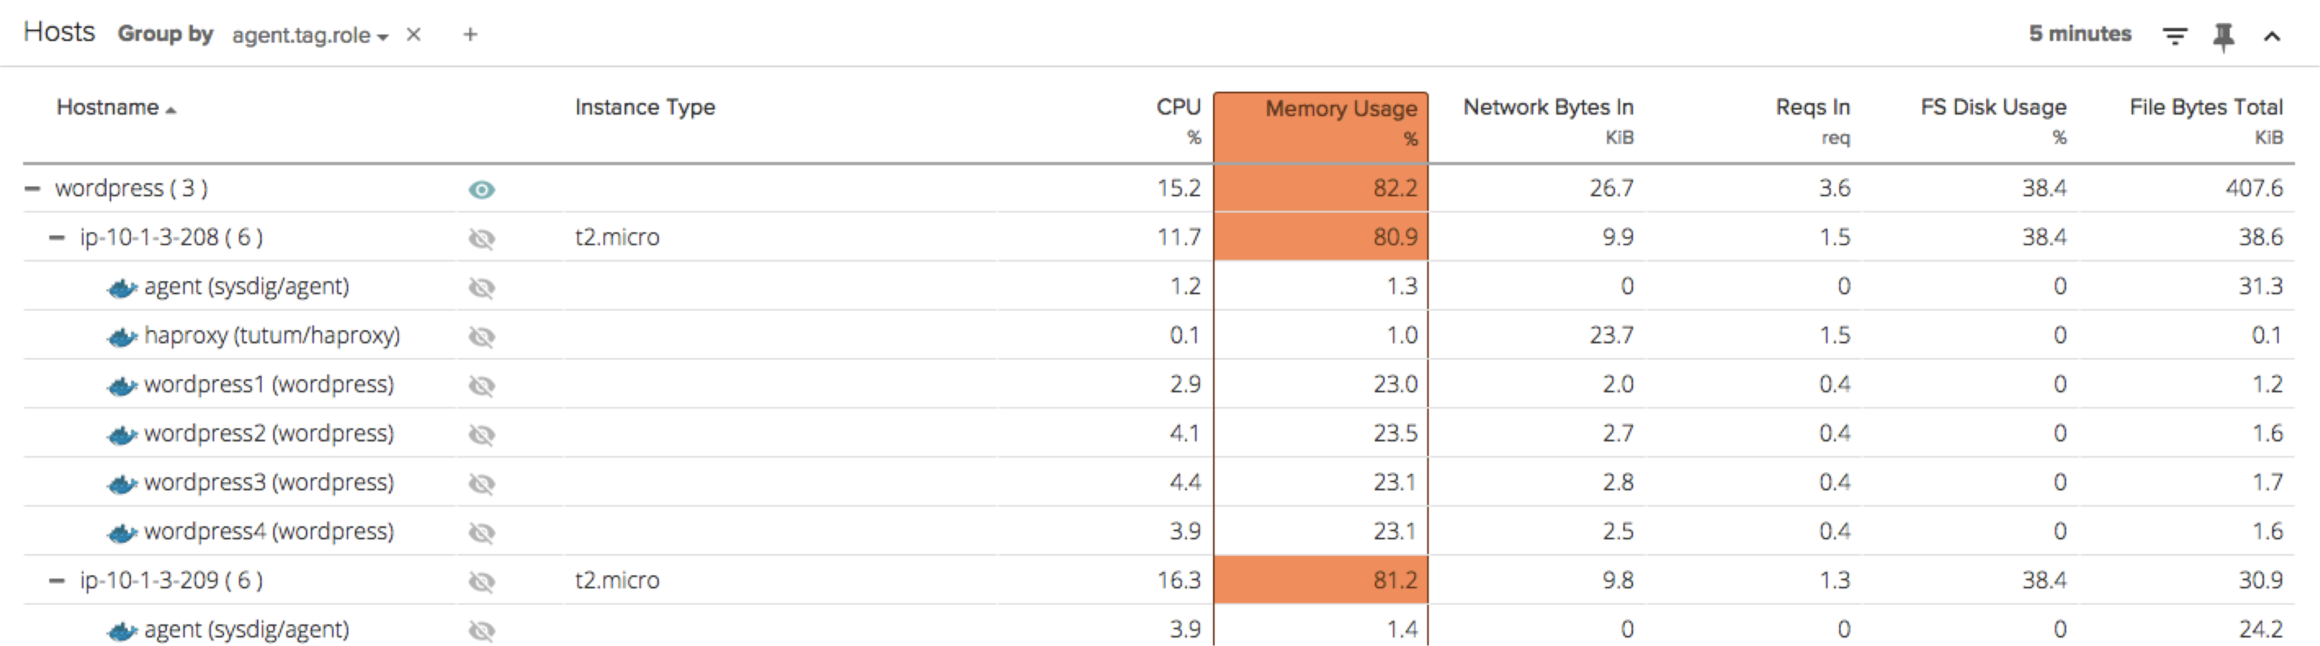
Hierarchical grouping, pervasive throughout the product, makes monitoring even large, dynamic infrastructures natural and intuitive. Insights are available at every level of granularity – so you can, for example, easily see memory usage or CPU% for an entire cluster of container images. Grouping is based on zero-config tags, that are automatically pulled from AWS or generated based on your existing infrastructure.
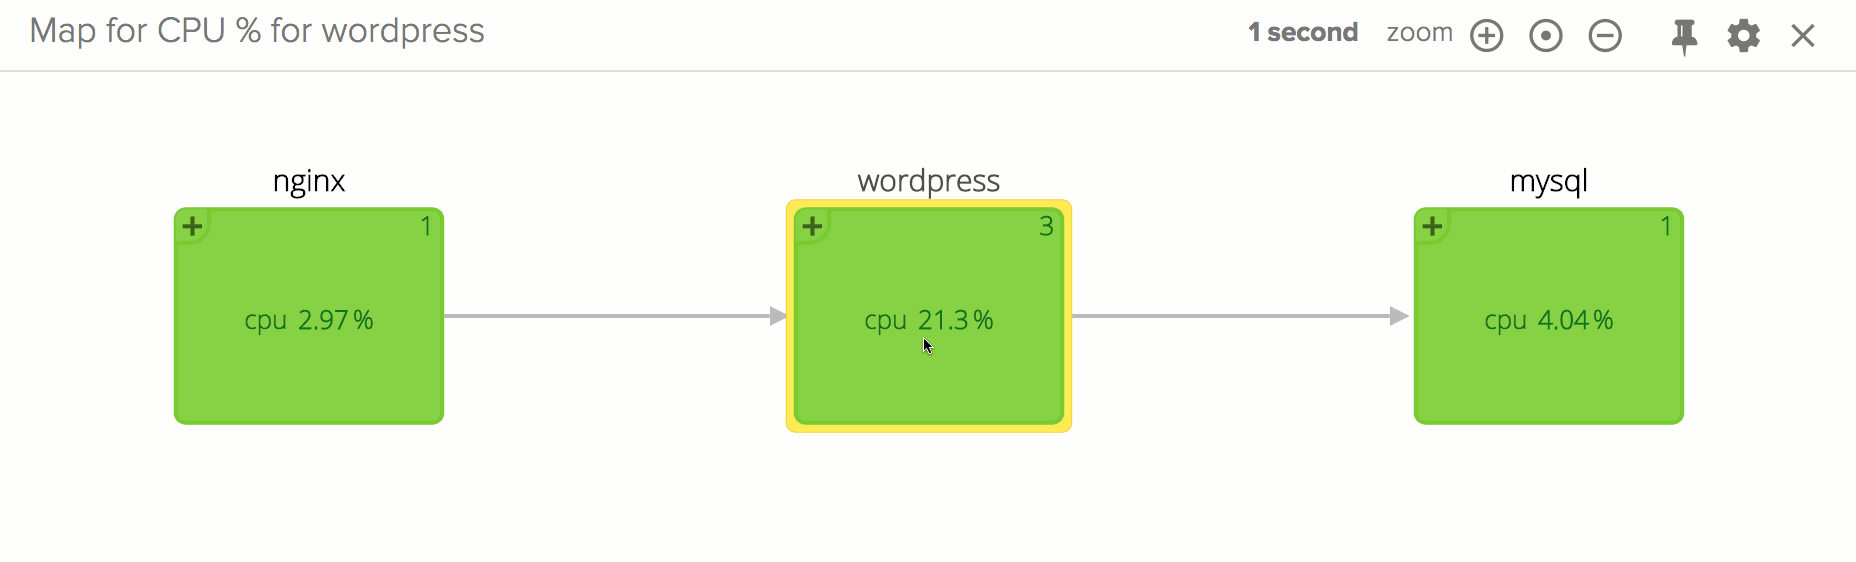
Switch to the famous map view, and with the flick of your mouse wheel, you can zoom in on any part of your infrastructure – starting at the highest level and drilling all the way down to a particular process inside a container.
Note that Sysdig Cloud automatically discovers the containers in your environment, groups them logically within a multi-tiered grouping hierarchy, and understands the dependencies of each container in the context of your overall environment. It is important to stress, this is all done out of the box, with no additional setup or configuration required. Simply install the agent on the host machine or in a privileged container, and you’re good to go.
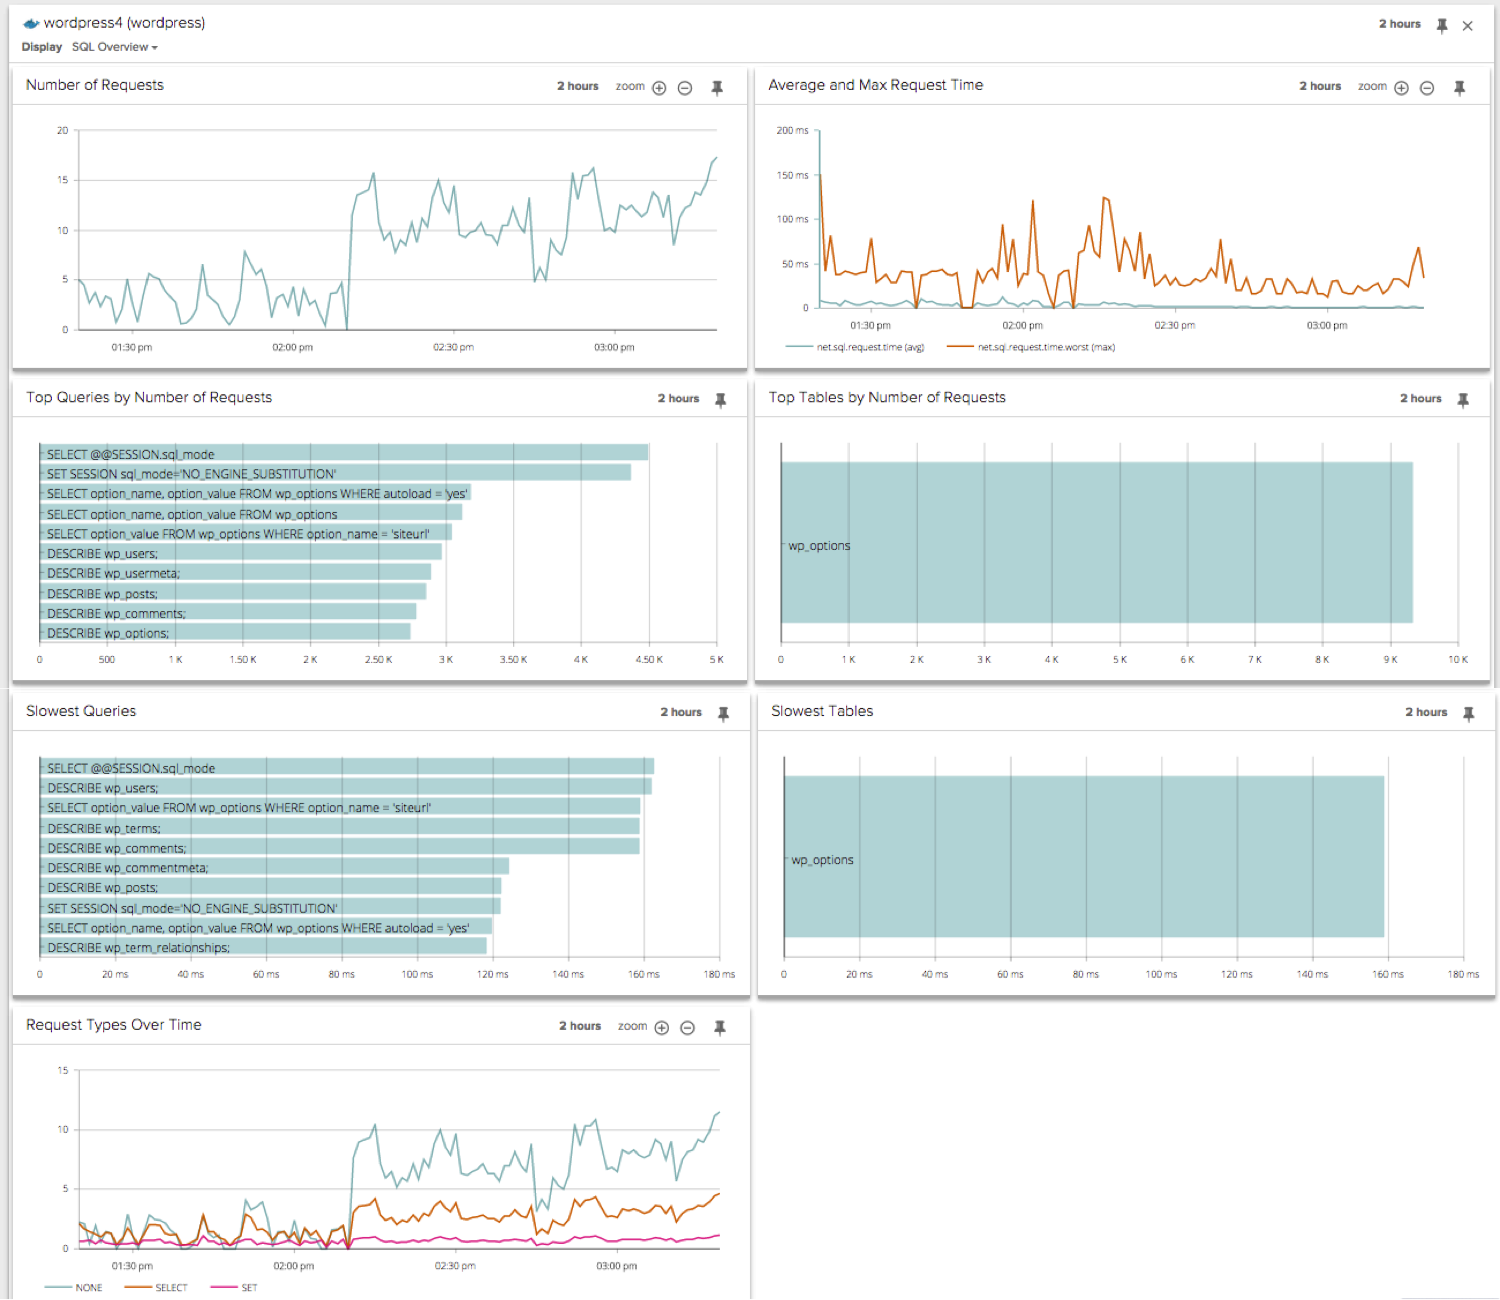
But these are just the macro views. Sysdig Cloud also surfaces a rich set of application and infrastructure activity from inside each container. For example, you can drill down to a new built-in view called “Container Overview” to inspect the system-level metrics of a container.

You can see SQL activity inside a container:
You can monitor HTTP performance inside a particular container:

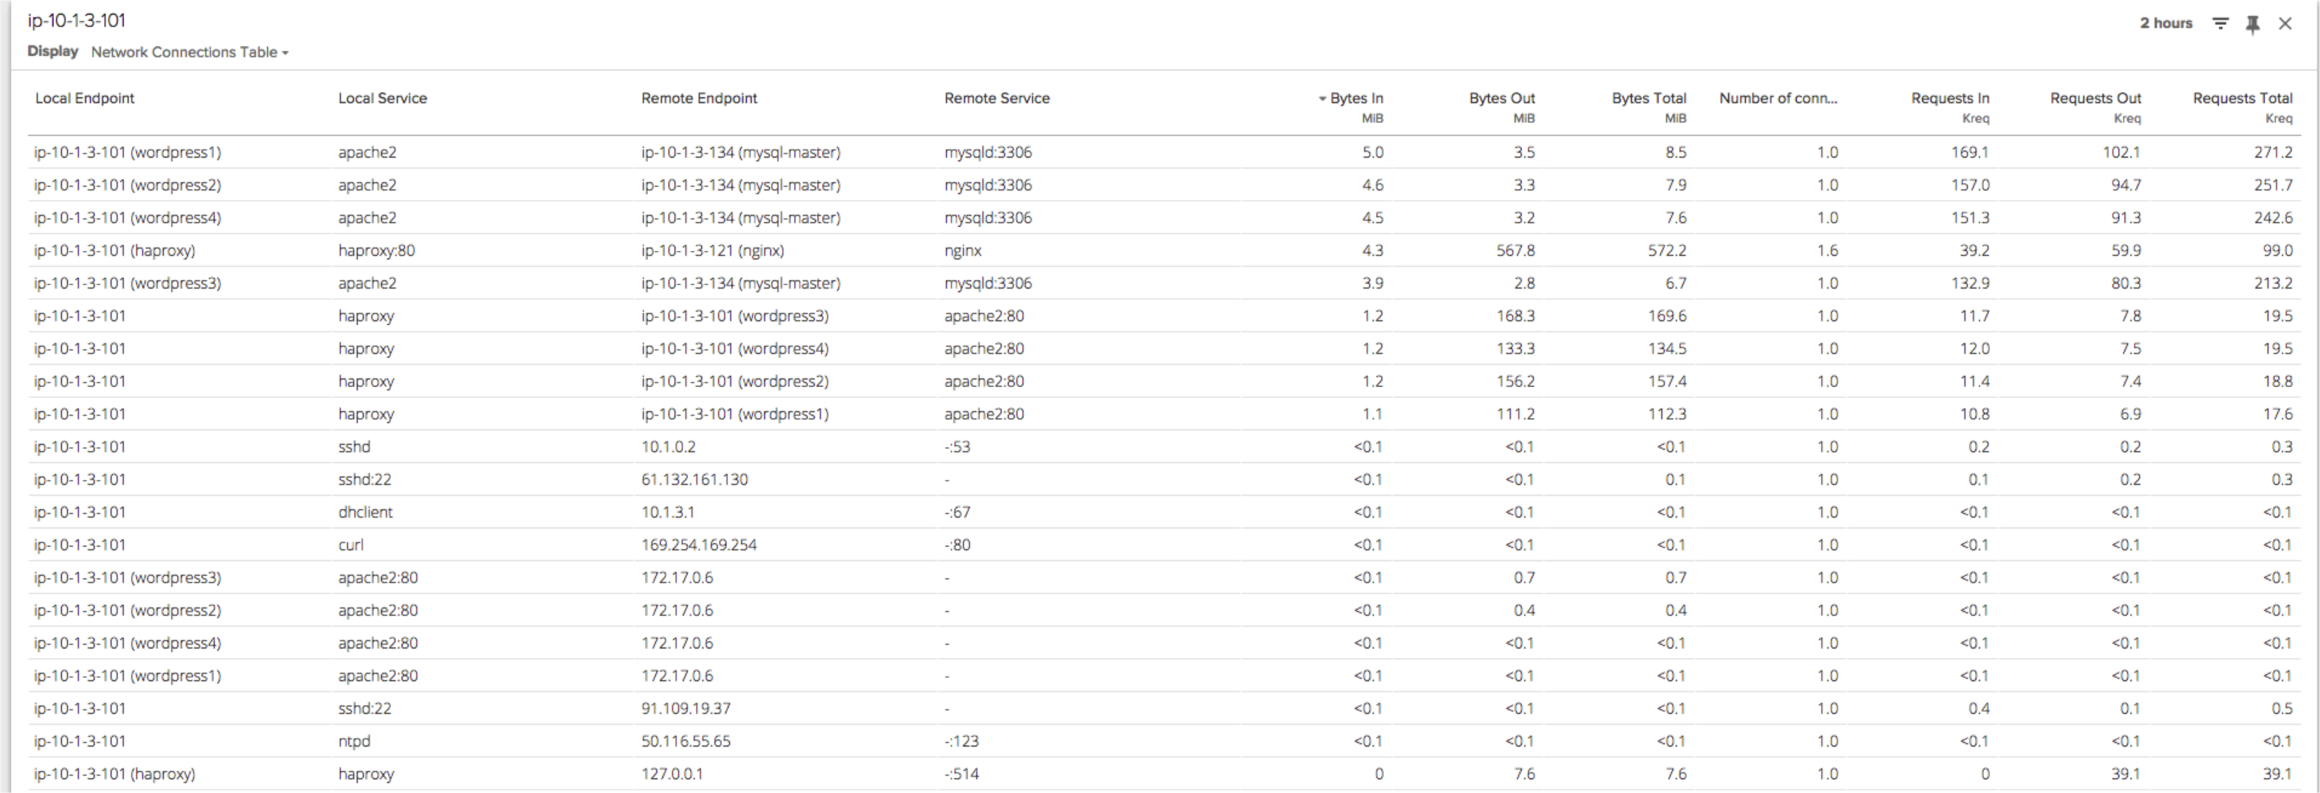
Here is a network connections table that shows network activity flowing through a group of containers:
And of course, as always, all of the data in Sysdig Cloud is delivered with process level granularity and one second level granularity.
Sysdig Cloud also stores all of this data for your whole infrastructure, and lets you replay it with DVR-like functionality. You can pause the live data stream, jump back in time, step back and forth through time, and even replay the entire activity of your container-based infrastructure at any arbitrary point in time. Now you can retroactively analyze and troubleshoot container performance issues with the full context of everything that was occurring at the time.
You can also compare metrics across any two points in time, in order to analyze performance changes around specific events, such as code and container deploys:
Plus, Sysdig Cloud self-learns the normal performance of your containerized environment and automatically alerts you when observed behavior deviates from expected performance. Be the first to know the instant performance abnormalities occur.

Conclusion
I hope you are as excited as we are about our revolutionary container monitoring solution. Sysdig Cloud has managed to push the envelope once again by providing the same deep system visibility you’ve grown to rely on, and applying that to modern containerized environments. Now, organizations leveraging container technologies finally have a solution that can provide maximum visibility inside containers without needing to instrument the container itself.
So please, if you’ve been wavering on making the leap to containers – if you’re unsure of your ability to monitor and troubleshoot in this brave new world – go for it! We’ve got your back.
If you’d like to try the beta out for yourself, sign up for Sysdig Cloud today and please tell us what you think!