
Command-line utilities like lsof, ps, and netstat may be basic, but they are surprisingly powerful. Many of us still love them and use them regularly. For those that aren’t familiar: * ps: displays the currently-running processes * netstat: displays network connections, routing tables, and other network statistics * lsof: lists open file descriptors and the processes that opened them
Wouldn’t it be cool if these tools had Wireshark-like filtering capabilities and the ability to run on any given point in time, past or present – for example when an error happens or when a process exits? In this post I’d like to show you how to accomplish exactly that – using sysdig of course! I’m dividing up the post into two parts:
A bit of easy theory to explain how lsof works (and other tools like ps and netstat), and how sysdig compares to them.
A set of practical use cases that will teach you how to leverage filters and sysdig’s back in time functionality to troubleshoot issues or detect leaks like a pro.
If you are not interested in theory, feel free to skip the first part and jump to the section named “lsof + filters”.
lsof and the /proc file system
lsof does something that in principle is quite simple: it lists the open file descriptors for a machine or for a process.
$ sudo lsof -p 41113
COMMAND   PID  USER   FD   TYPE             DEVICE  SIZE/OFF     NODE NAME
mysqld  41113 mysql  cwd    DIR              253,1      4096   931157 /opt/lampp/var/mysql
mysqld  41113 mysql  rtd    DIR              253,1      4096        2 /
mysqld  41113 mysql  txt    REG              253,1  10091608   945718 /opt/lampp/sbin/mysqld
mysqld  41113 mysql  mem    REG              253,1    162616   695538 /usr/lib64/ld-2.16.so
mysqld  41113 mysql  mem    REG              253,1   2071376   695539 /usr/lib64/libc-2.16.so
mysqld  41113 mysql  mem    REG              253,1     22440   695549 /usr/lib64/libdl-2.16.so
mysqld  41113 mysql  mem    REG              253,1    144552   681357 /usr/lib64/libpthread-2.16.so
mysqld  41113 mysql  mem    REG              253,1     47624   695557 /usr/lib64/librt-2.16.so
mysqld  41113 mysql  mem    REG              253,1   1139968   695540 /usr/lib64/libm-2.16.so
mysqld  41113 mysql  mem    REG              253,1    434224   682502 /usr/lib64/libfreebl3.so
mysqld  41113 mysql  mem    REG              253,1     43808   695611 /usr/lib64/libcrypt-2.16.so
mysqld  41113 mysql  mem    REG              253,1     91352   704978 /usr/lib64/libgcc_s-4.7.2-20121109.so.1
mysqld  41113 mysql  mem    REG              253,1     62416   670511 /usr/lib64/libnss_files-2.16.so
mysqld  41113 mysql  mem    REG              253,1    973680   946274 /opt/lampp/lib/libstdc++.so.6.0.8
mysqld  41113 mysql  mem    REG              253,1   1851440   946268 /opt/lampp/lib/libcrypto.so.1.0.0
mysqld  41113 mysql  mem    REG              253,1     90128   946242 /opt/lampp/lib/libz.so.1.2.8
mysqld  41113 mysql  mem    REG              253,1    416080   946237 /opt/lampp/lib/libssl.so.1.0.0
mysqld  41113 mysql    0r   CHR                1,3       0t0     1028 /dev/null
mysqld  41113 mysql    1w   REG              253,1     40605   948996 /opt/lampp/var/mysql/localhost.localdomain.err
mysqld  41113 mysql    2w   REG              253,1     40605   948996 /opt/lampp/var/mysql/localhost.localdomain.err
mysqld  41113 mysql    3uW  REG              253,1 329252864   948997 /opt/lampp/var/mysql/ibdata1
mysqld  41113 mysql    4u   REG               0,31         0 15836611 /tmp/ibBexiL2 (deleted)
mysqld  41113 mysql    5u   REG               0,31         0 15836612 /tmp/ib85pBUO (deleted)
mysqld  41113 mysql    6u   REG               0,31         0 15836613 /tmp/ibrfMY3A (deleted)
mysqld  41113 mysql    7u   REG               0,31         0 15836614 /tmp/ibh6XUfn (deleted)
mysqld  41113 mysql    8uW  REG              253,1   5242880   948998 /opt/lampp/var/mysql/ib_logfile0
mysqld  41113 mysql    9uW  REG              253,1   5242880   948999 /opt/lampp/var/mysql/ib_logfile1
mysqld  41113 mysql   10u  IPv4           15836616       0t0      TCP *:mysql (LISTEN)
mysqld  41113 mysql   11u   REG               0,31         0 15836615 /tmp/ibY8sHya (deleted)
mysqld  41113 mysql   12u  unix 0xffff88000cac8680       0t0 15836617 /opt/lampp/var/mysql/mysql.sock
...
Despite being based on a simple concept, lsof is super useful in a bunch of situations. The reason is that pretty much anything on a unix machine is represented as a file descriptor: files, directories, network connections, pipes, events, and much more. As a consequence, lsof can see a lot of stuff and can be used to answer many interesting questions. For example:
- Which network connections does process X have?
- Who is connecting to a specific endpoint?
- Which processes have open files in /etc?
lsof leverages an extremely powerful feature of the linux kernel: the /proc file system. The kernel exports a lot of internal information under /proc, which you can browse with ls and manipulate with a normal text editor. If you look at the content of the /proc directory, you see several subdirectories with a number as their name. Those are PIDs, and each of those subdirectories contains the details of a specific process. Inside, among other things, there’s the list of file descriptors for that process. At this point, understanding what lsof does becomes pretty easy and is shown in the picture below.
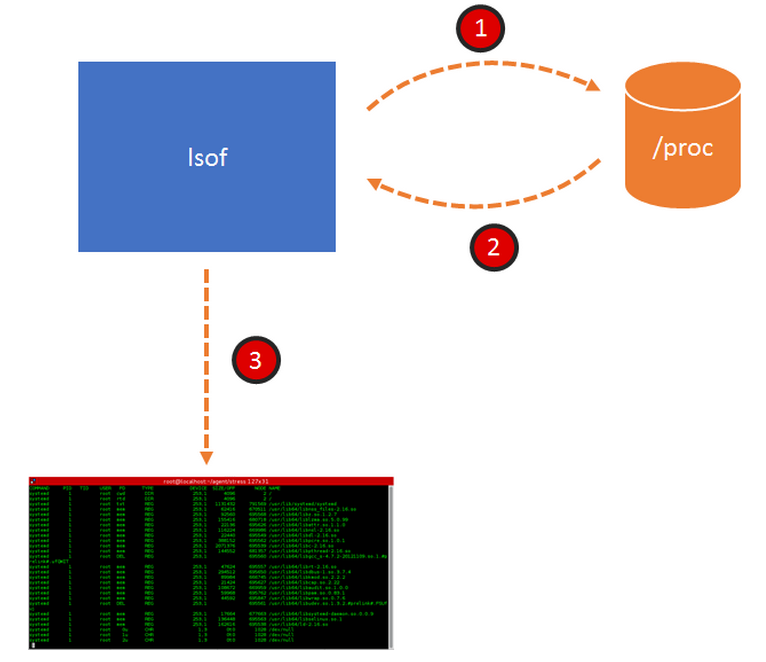 lsof:
lsof:
- navigates /proc
- collects all the FD information it can find
- spits the information to the console.
Most of the other linux tools that you use every day (ps, top, netstat to name a few) work exactly the same way. You can think about them as user interfaces for /proc.
How is sysdig different?
Sysdig operates in a slightly more complex way, shown in this picture:
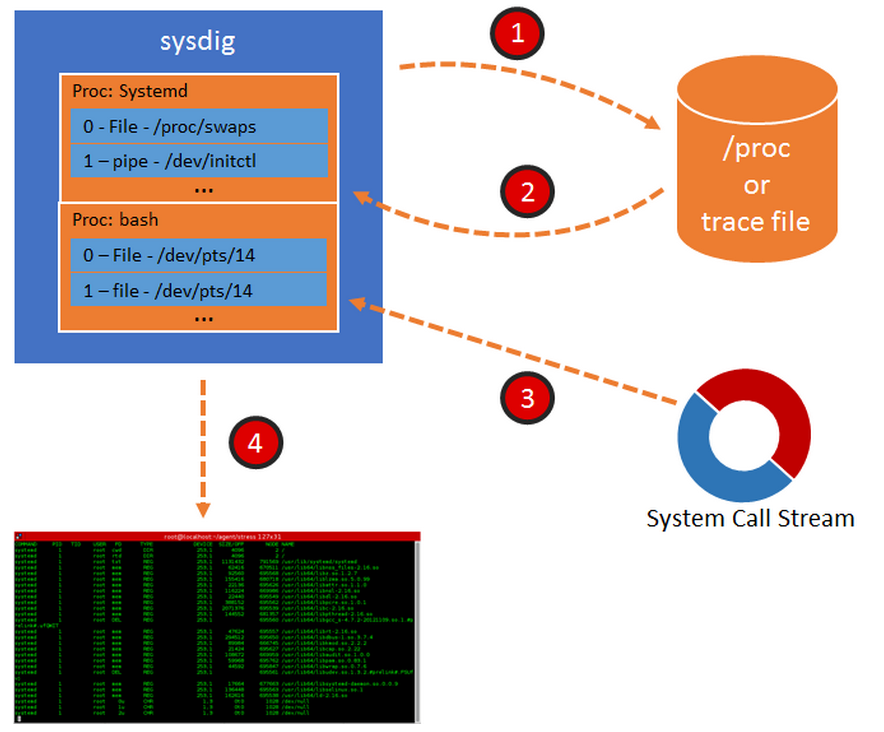 1. Sysdig collects data from /proc when it starts, exactly like lsof or ps, but … 2. Instead of just dumping the results, it stores them in a table. This table contains the list of processes and threads and, for each of them, the list of FDs. 3. Sysdig then starts capturing every system call. When it encounters a system call that causes a change in system state, sysdig updates the table. For example, an open() or a connect() cause a new FD to be created in the system; sysdig intercepts them and adds an entry to the table. A close() causes an FD to disappear from the system, and therefore sysdig removes it from its table. All of this is super fast, and the result is that now sysdig has a mirror of /proc, constantly up to date, that can be queried with minimal overhead. 4. Thanks to this constantly updated table, sysdig can do a bunch of magic, some of which is going to be shown in the rest of this blog post.
But wait, sysdig can also take trace files! When you do that, using the sysdig -w command line flag, sysdig starts by scanning /proc and dumping the whole process table to disk, and then saves each system call to file after that. Later, when you open the file for analysis, the process is similar to the one depicted above, but this time the process table is loaded from file. This means that you can enjoy a precise snapshot of the state of the system on which the capture was taken, including its evolution in time according to the events that were captured. Think about it as a Tivo for your linux instance. All right, enough theory. Let’s see what we can do with this data!
lsof + filters
The latest sysdig release adds three new entries to the sysdig chisel library: lsof, ps, and netstat. The names should make it very clear what they do. It’s worth pointing out, however, that the data comes from the sysdig process table and not from proc and this means that I can use sysdig’s powerful filtering language to decide what to see and when I want to see it. Let’s start with the what. By default, the lsof chisel shows the full system state, exactly like the lsof tool, which is usually a lot of information. I can slice and dice it any way I want with filters. Here, for example, is the list of log files that apache is writing to:
$ sudo sysdig -c lsof "'proc.name contains http and fd.name contains log'"
COMMAND             PID     TID     USER    FD      TYPE        NAME
httpd               40720   40720   root    2       file        /opt/lampp/logs/error_log
httpd               40720   40720   root    8       file        /opt/lampp/logs/error_log
httpd               40720   40720   root    9       file        /opt/lampp/logs/access_log
httpd               40720   40720   root    10      file        /opt/lampp/logs/access_log
httpd               40720   40720   root    11      file        /opt/lampp/logs/ssl_request_log
(note how the filter is in both single and double quotes. Sorry for the weird syntax…) And here’s the list of network connections established by the user root:
$ sudo sysdig -c lsof "'fd.type=ipv4 and user.name=root'"
COMMAND             PID     TID     USER    FD      TYPE        NAME
sshd                891     891     root    3       ipv4        0.0.0.0:22
cupsd               1324    1324    root    11      ipv4        127.0.0.1:631
cupsd               1324    1324    root    12      ipv4        0.0.0.0:631
dhclient            15162   15162   root    20      ipv4        0.0.0.0:21976
dhclient            15162   15162   root    6       ipv4        0.0.0.0:68
DOM                 52382   24604   root    46      ipv4        192.168.199.193:50549->74.125.239.105:80
DOM                 52382   24604   root    47      ipv4        192.168.199.193:44254->74.125.239.142:80
DOM                 52382   24604   root    38      ipv4        192.168.199.189:46951->63.245.216.132:443
firefox             52382   28734   root    46      ipv4        192.168.199.193:50549->74.125.239.105:80
firefox             52382   28734   root    47      ipv4        192.168.199.193:44254->74.125.239.142:80
firefox             52382   28734   root    38      ipv4        192.168.199.189:46951->63.245.216.132:443
dhclient            33763   33763   root    20      ipv4        0.0.0.0:46380
dhclient            33763   33763   root    6       ipv4        0.0.0.0:68
sendmail            33786   33786   root    4       ipv4        127.0.0.1:25
Hmm, firefox shouldn’t be run as root… And here are all the files currently open under /etc:
$ sudo sysdig -c lsof "'fd.name contains /etc'"
COMMAND PID TID USER FD TYPE NAME systemd-udevd 359 359 root 11 file /etc/udev/hwdb.bin proftpd 40759 40759 daemon 3 file /etc/group proftpd 40759 40759 daemon 4 file /etc/passwd
ps + filters
I find the ps chisel even more interesting. It’s like ps on steroids, because you can specify conditions on both what the process is and what it’s doing. Let me give you some examples. This lists the processes or threads that act as servers on ports different from 80:
$ sudo sysdig -c ps "'fd.type=ipv4 and fd.is_server=true and fd.sport!=80'"
TID     PID     USER        VIRT       RES        FDLIMIT   CMD
539     539     chrony      22.02M     592.00KB   1024      chronyd
891     891     root        80.59M     216.00KB   1024      sshd
896     896     rpc         18.72M     220.00KB   1024      rpcbind
1324    1324    root        201.91M    1.18M      4096      cupsd
15162   15162   root        92.54M     952.00KB   1024      dhclient
33763   33763   root        92.54M     1016.00KB  1024      dhclient
33786   33786   root        92.20M     612.00KB   1024      sendmail
38081   38081   redis       1013.47M   2.38M      4016      redis-server
38082   38081   redis       1013.47M   2.38M      4016      redis-server
38083   38081   redis       1013.47M   2.38M      4016      redis-server
41113   41113   mysql       269.44M    30.75M     1024      mysqld
41122   41113   mysql       269.44M    30.75M     1024      mysqld
41123   41113   mysql       269.44M    30.75M     1024      mysqld
41124   41113   mysql       269.44M    30.75M     1024      mysqld
41125   41113   mysql       269.44M    30.75M     1024      mysqld
41126   41113   mysql       269.44M    30.75M     1024      mysqld
41127   41113   mysql       269.44M    30.75M     1024      mysqld
This lists the processes that have files open in /etc and have network connections:
$ sudo sysdig -c ps "'fd.name contains /etc or fd.type=ipv4'"
TID     PID     USER        VIRT       RES        FDLIMIT   CMD
539     539     chrony      22.02M     592.00KB   1024      chronyd
and this is the list of processes that don’t have bash as an ancestor or, in other words, the list of system processes:
$ sudo sysdig -c ps "'not(proc.aname contains bash)'"
TID     PID     USER        VIRT       RES        FDLIMIT   CMD
1       1       root        50.31M     3.09M      65536     systemd
359     359     root        41.93M     752.00KB   1024      systemd-udevd
361     361     root        50.21M     1.07M      16384     systemd-journal
472     472     root        49.75M     276.00KB   1024      auditd
483     472     root        49.75M     276.00KB   1024      auditd
484     484     root        78.30M     196.00KB   1024      audispd
486     486     root        23.35M     180.00KB   1024      sedispatch
487     484     root        78.30M     196.00KB   1024      audispd
496     496     root        140.09M    468.00KB   1024      abrtd
498     498     root        137.93M    308.00KB   1024      abrt-watch-log
499     499     root        4.17M      60.00KB    1024      rngd
502     502     root        137.93M    292.00KB   1024      abrt-watch-log
509     509     root        32.14M     572.00KB   16384     systemd-logind
510     510     root        286.46M    1.02M      1024      accounts-daemon
...
Well, you get the idea: the same
language that you use to filter sysdig events can be used to filter the process list.
lsof and ps + time navigation
I’ve shown how to decide what to see, now let’s get into the when. The lsof, ps, and netstat chisels show you the content of sysdig’s process table when they receive the first event from the sysdig capture. This means that, by default, they stop and dump the table right away (at event number 1), very similarly to what the real ps, lsof, and netstat do. However, the first received event is controllable with a capture filter, and that lets us get the result at a precise point in time, which is impossible to do with the original unix command lines. Let me give you an example: suppose I want to figure out if my program is leaking file descriptors. One way to do it is by checking the program’s list of open file descriptors when it exits. This is something lsof would be perfect for, the only problem is: it’s absolutely not trivial to synchronize lsof so I can get its output exactly when my program exits. With sysdig? A simple command line:
$ sudo sysdig -c lsof "'proc.name=myapp'" proc.name=myapp and evt.type=procexit
COMMAND             PID     TID     USER    FD      TYPE        NAME
myapp               43073   43073   loris   0       file        /dev/pts/15
myapp               43073   43073   loris   1       file        /dev/pts/15
myapp               43073   43073   loris   2       file        /dev/pts/15
myapp               43073   43073   loris   3       file        /home/loris/myapp.log
myapp               43073   43073   loris   4       file        /home/loris/myapp.log
myapp               43073   43073   loris   5       file        /home/loris/myapp.log
myapp               43073   43073   loris   6       file        /home/loris/myapp.log
myapp               43073   43073   loris   7       file        /home/loris/myapp.log
myapp               43073   43073   loris   8       file        /home/loris/myapp.log
myapp               43073   43073   loris   9       file        /home/loris/myapp.log
myapp               43073   43073   loris   10      file        /home/loris/myapp.log
myapp               43073   43073   loris   11      file        /home/loris/myapp.log
myapp               43073   43073   loris   12      file        /home/loris/myapp.log
myapp               43073   43073   loris   13      file        /home/loris/myapp.log
myapp               43073   43073   loris   14      file        /home/loris/myapp.log
myapp               43073   43073   loris   15      file        /home/loris/myapp.log
myapp               43073   43073   loris   16      file        /home/loris/myapp.log
myapp               43073   43073   loris   17      file        /home/loris/myapp.log
...
Note how this time there are two filters on this command line:
- The first filter is in the quotes and specifies what I want to see – in this case, I want to see the file descriptors for processes called ‘myapp’.
- The second filter determines when I want to see it, and means “wait until a procexit event arrives for a process called myapp.” Procexit is generated when a process ends its life, either in a clean way or because of an error.
Clearly it looks like my program forgot to close the file after writing to its log file. Let’s fix the program and try again:
$ sudo sysdig -c lsof "'proc.name=myapp'" proc.name=myapp and evt.type=procexit
COMMAND             PID     TID     USER    FD      TYPE        NAME
myapp               43073   43073   loris   0       file        /dev/pts/15
myapp               43073   43073   loris   1       file        /dev/pts/15
myapp               43073   43073   loris   2       file        /dev/pts/15
Much better – this is what I would expect from a properly behaving program: stdin, stdout and stderr.
Final notes
Getting the list of file descriptors when a process exits is a good showcase for the time navigation feature, but there are several other interesting use cases. For example:
- Look at the FD table when a specific I/O error occurs. The evt.failed and evt.res filter fields are your friends here.
- Explore system state around a log event. Refer to the recent blog post on sysdig + logs for filter examples.
- Explore system state at a specific time, by using the evt.datetime filter.
Also, a few things to keep in mind:
- All of the examples in this post will work with trace files as well. As I mentioned, sysdig dumps the content of /proc in each trace file, and then updates the state for each event. The result is that you can run ps or lsof at any arbitrary point in the capture.
- One of the big advantages of the approach used by sysdig is low overhead. Since the FD table is kept in memory and built incrementally, it can be dumped with very low overhead and without generating a burst of accesses to /proc around the observation point.
- This low overhead becomes particularly interesting when you keep in mind that this functionality is consumable through the chisels Lua API. The lsof, ps, and netstat chisels are just trivial wrappers around the sysdig.get_thread_table() chisel API function. A lot more interesting stuff can be built on top of it. Did I hear somebody say top time travel? :-)